

Scope 3 can account for 70-90% of an organisation’s total carbon footprint. These indirect emissions arise from activities across its upstream and downstream value chain, including purchased goods, transport and the use of sold products. The scope 3 emissions calculation challenges often start with a practical problem: tracing emissions through complex products and multi-tier supply chains.
If you’re finding that a single product can involve suppliers, materials and processes beyond your direct control, you’re right to look beyond your own operations. A useful calculation doesn’t require perfect data from every supplier at the outset. It needs clear boundaries, a suitable method and transparent assumptions.
This article explains what Scope 3 emissions cover and how spend-based, activity-based and supplier-specific calculations differ. It also shows how to screen categories, prioritise emissions hotspots, address inconsistent data and make sense of complex product supply chains. You’ll learn where estimates can help, when more detailed supplier data matters, and how to build a calculation that supports practical decisions rather than just producing a figure.
Key Takeaways
- Match the calculation method to the data you have, then improve detail where the largest emissions are concentrated.
- Screen the full value chain before prioritising categories, so your detailed work targets material sources rather than assumptions.
- Record boundaries, data sources and methodology choices to make results more consistent from one reporting cycle to the next.
- Break complex products into their supply-chain stages to identify where emissions data is missing and where better supplier information can help.
- Use a practical data plan to turn calculation findings into clearer priorities for procurement and product decisions.
Spend-based, quantity-based and supplier-specific calculations
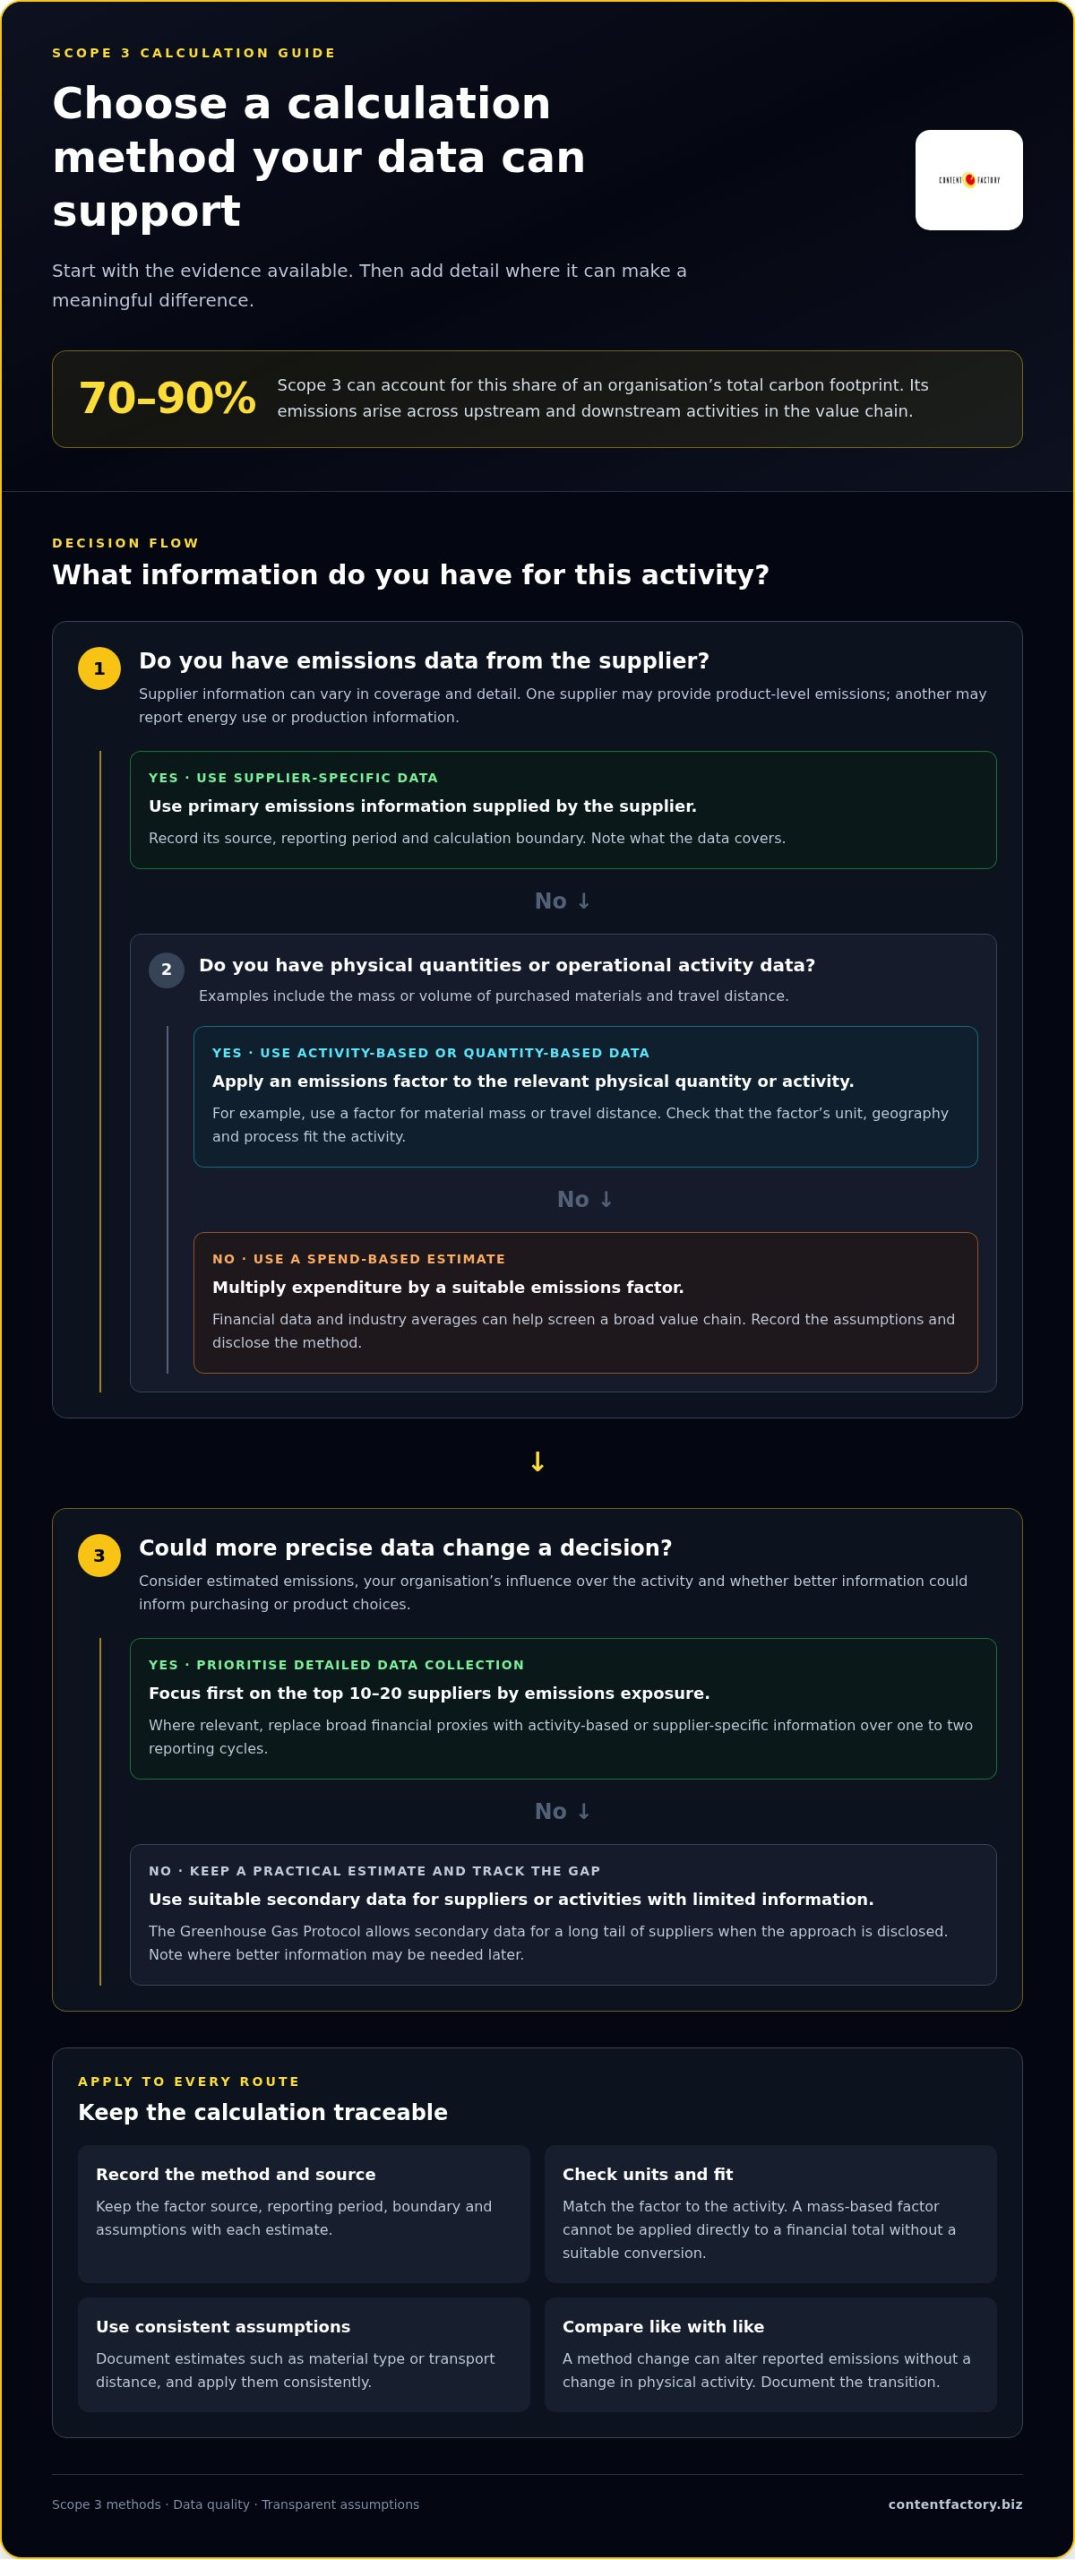
Spend-based estimates apply financial data and industry averages. Activity-based methods use physical quantities or operational data. Supplier-specific calculations use information provided by suppliers. Where data is unavailable, you can estimate emissions using documented assumptions and secondary sources.
No method has a single accuracy level: the detail and quality of the data determine how closely the result reflects actual emissions. If supplier data is unavailable, use spend or activity data, record your assumptions and disclose the method.
Comparing Calculation Approaches
A spend-based calculation multiplies expenditure by an emissions factor. A quantity-based calculation applies factors to purchased volumes, such as the mass of a material. Activity-based methods use operational data, such as travel distance. Supplier-specific calculations use primary emissions data from suppliers. The method matters: financial averages can screen a broad value chain, while physical and supplier data can distinguish products and processes in greater detail.
For example, a Singapore business could estimate emissions from purchased packaging using expenditure, then refine the estimate with material quantities or supplier data where the emissions are most relevant. The Greenhouse Gas Protocol allows secondary data for a long tail of suppliers, provided the organisation discloses its approach.
Using Supplier Data and Estimates
Supplier and partner data may cover upstream materials, manufacturing, transport and logistics, but information can be uneven across a supply chain. One supplier might provide product-level emissions data, while another reports only energy use or production information. Because these inputs differ in coverage and detail, record the source and boundary for each estimate.
When data is missing, use available spend or activity information with a suitable secondary emissions factor. Document assumptions, such as material type or transport distance, and apply them consistently. A SaaS calculation tool can centralise supplier requests, evidence and calculation records, but its output still depends on the quality of the inputs and assumptions.
Moving Toward Supplier-Specific Data
Moving from spend-based estimates to supplier-specific data means improving detail first where emissions exposure is highest. Prioritise the top 10-20 suppliers by emissions exposure, then replace broad financial proxies with activity-based or supplier-specific information over one to two reporting cycles. This concentrates data collection where it can materially change the inventory.
Use primary data from suppliers when available, and secondary databases to estimate remaining gaps. Record the factor source, reporting period and calculation boundary alongside each figure. A method change can alter reported emissions without a corresponding change in physical activity, so document the transition and compare like with like.
SaaS tools can support supplier collaboration through structured data requests, shared templates and response records. They can also help organise secondary factors alongside supplier submissions. To get started, separate the inventory into three data groups:
- Supplier-specific primary data for high-emissions purchases.
- Activity data for measurable items such as transport distance or material quantity.
- Secondary estimates for suppliers and activities with limited information.
Consistent records make estimates easier to revisit as supplier data improves. A structured carbon accounting approach can connect calculation methods, data sources and assumptions across the inventory.
Which scope 3 categories should I prioritize for detailed calculation?
Prioritise detailed work where better information could change a decision, not simply where records are easiest to access. Consider estimated emissions, your organisation’s influence over the activity and whether more precise data could inform purchasing or product choices. These criteria help direct carbon accounting effort towards useful outcomes.
Category selection also depends on how purchases are described in your records. An invoice may group several materials under one supplier account, while emissions factors distinguish material types or production processes. Procurement staff can explain the purchase, accounting staff can clarify the transaction, and sustainability staff can assess the factor and boundary. Combining these perspectives improves classification.
Choosing a matching label is not enough when applying an emissions factor. Check that its unit aligns with the activity data and that its geography and process are relevant. For example, you cannot apply a mass-based factor directly to a financial total without a suitable conversion. Record these decisions so a reviewer can understand why you selected the factor.
- Data ownership: assign responsibility for collecting each source and resolving missing fields.
- Factor selection: record the factor’s unit, scope and relationship to the activity.
- Quality review: flag mismatched units, duplicate records and unexplained changes.
- Improvement planning: note which data gap to address when the calculation is next updated.
Set a common data format before collection begins to reduce administrative effort. Ask each contributing team to provide the activity, unit, period and source together. A purchase record without a clear description may need procurement context; an operational record may need clarification from the team that produced it. A defined hand-off reduces repeat follow-ups and makes gaps easier to resolve.
Assign ownership for both the calculation and its source data. A category lead can coordinate inputs, while the relevant teams remain responsible for the records they produce. Keep a change log for updated factors, revised classifications and corrected source data. This helps distinguish a genuine change in activity from an improved calculation method.
For a practical review of priorities, data responsibilities and calculation inputs, discuss your carbon accounting needs.
Screening Scope 3 categories and identifying hotspots
Screening maps your activities against the Greenhouse Gas Protocol’s categories, then directs detailed analysis towards material sources. The result is a defensible view of where greenhouse gas emissions arise across your organisation’s value chain.
Identifying Applicable Categories
Applicable categories are those connected to your organisation’s activities, assets, purchases or products. The Greenhouse Gas Protocol identifies 15 Scope 3 categories:
- Purchased goods and services: goods and services bought.
- Capital goods: long-term assets purchased.
- Fuel- and energy-related activities: activities outside Scopes 1 and 2.
- Upstream transport and distribution: inbound movement and storage.
- Waste generated in operations: treatment of operational waste.
- Business travel: employee travel for work.
- Employee commuting: travel between home and work.
- Upstream leased assets: leased assets used by the organisation.
- Downstream transport and distribution: movement after product sale.
- Processing of sold products: further processing by customers.
- Use of sold products: emissions during product use.
- End-of-life treatment: disposal or treatment after use.
- Downstream leased assets: assets leased to others.
- Franchises: franchise operations outside the inventory boundary.
- Investments: emissions associated with investments.
Review each category against your business activities and document why it applies or does not. This helps prevent an activity being overlooked simply because another department owns its records.
Understanding Upstream and Downstream Categories
Upstream categories cover goods, services and activities that support your organisation. Downstream categories cover sold products and activities after sale. A company can have emissions on both sides of its operations, so the distinction matters.
For example, compare invoices for incoming freight with records for distributing sold goods. Map each activity by its relationship to your organisation, then assign the relevant category. This clarifies the value-chain boundary and helps prevent the same movement from being counted twice.
For hotspot screening, compare category estimates using the same reporting period and consistent units. Look for concentrations across activities, not just large individual transactions. The top 20% of suppliers by spend typically account for 60-80% of procurement-related emissions, so spend can help flag where further analysis may be useful.
Invoices and travel records offer different clues. Group invoice descriptions into relevant purchase types, and classify travel claims by journey purpose and transport mode where possible. If you cannot assign a record confidently, mark it for review rather than forcing it into a category. This keeps screening transparent and shows where better records could improve the footprint estimate.
Use the resulting map to prioritise investigation by estimated emissions, data quality and the organisation’s ability to influence the activity. A category with uncertain estimates may need review, while a well-supported, low-emissions category can remain under routine monitoring. To discuss your screening priorities, discuss your Scope 3 calculation priorities.
Inconsistent reporting methods and boundaries
For a Singapore company, Scope 3 disclosure depends on applicable reporting requirements and the organisation’s reporting obligations. Don’t assume one disclosure approach applies to every business; identify the framework and boundary relevant to your report.
Reporting Methods and Transparency
Transparent reporting explains how a footprint was measured, not just the final figure. The Greenhouse Gas Protocol recommends documenting data sources, methods and emissions factors so readers can follow the reported results. Record whether data is primary or secondary, which reporting period it covers, and any material assumptions. This detail makes sustainability reporting more useful when comparing figures across periods.
Under CSRD’s ESRS E1, in-scope companies must disclose the proportion of their Scope 3 inventory based on primary data versus secondary data. This requirement applies to companies within that framework’s scope, not automatically to every Singapore organisation. If your reporting uses CSRD, separate the data types clearly and explain their contribution to the reported inventory.
Reporting Boundaries and Double Counting
A reporting boundary defines which organisational activities and value-chain relationships belong in the footprint. Consistency matters when business units use different records or interpret categories differently. Define the organisational coverage and relevant activities, then apply those decisions consistently in each reporting period. Keep the boundary description with the calculation so readers understand what the total represents.
An activity can appear as direct emissions in a supplier’s inventory and indirect emissions in a customer’s Scope 3 inventory. Those are different reporting perspectives, not necessarily duplication within either company’s total. To prevent double counting inside your own inventory, identify each activity’s relationship to your organisation and check that category totals reconcile with the overall reported figure.
Estimation Uncertainty and Method Changes
Estimation uncertainty arises when source data, emissions factors or assumptions do not precisely represent the activity. The reported total may change as information improves, even if operations remain similar. Explain where estimates are used and why, so readers can distinguish data improvements from actual changes in greenhouse gas emissions.
A methodology change can also affect comparability. The supplied guidance states that a methodology change causing more than 5% variance in reported emissions may require baseline-year restatement under CSRD and SBTi. Treat that as a framework-specific consideration, not a universal Singapore rule. Keep the previous calculation basis and document the effect of the revised method.
Keep a reporting record linking each figure to its boundary, source, factor and method. This gives your team a consistent basis for reviewing changes and answering questions about the footprint. If a reporting framework changes or new supplier evidence becomes available, record the change and its effect rather than silently replacing earlier assumptions.
A structured GHG emissions calculation and carbon accounting process can align calculation records with reporting needs.
Calculating emissions for complex products
A product’s greenhouse gas footprint can span suppliers, manufacturing stages, transport and disposal. A shirt supply chain, for example, can extend seven or eight levels from cotton farming through manufacturing. These scope 3 emissions calculation challenges make it difficult to trace a product’s full footprint through its value chain.
Start with the product’s journey, not just the final supplier invoice. Map materials, processing stages, transport routes, product use and end-of-life treatment. Then connect each activity to the relevant Scope 3 category. The GHG Protocol’s 15 categories provide a structure, but the product’s actual journey determines which categories apply.
Keep the unit of analysis consistent. For a product calculation, define its specification and the quantity represented. For a product group, document which models or variants are included. A global consumer goods company may manage an inventory of tens of thousands of units, so mixing product types can hide differences in materials, manufacturing or transport.
Map each product stage in a separate row. For a shirt, record the fibre, fabric production, garment assembly and movement between suppliers. Add available activity data, such as material quantities or transport information, and flag gaps in supplier-specific information. This makes it clear where estimates enter the calculation instead of hiding them in a corporate average.
- Define the product: record its specification and the quantity covered by the calculation.
- Map its stages: trace materials, processing, transport, use and disposal where relevant.
- Assign categories: connect each activity to the appropriate Scope 3 category.
- Track evidence: retain supplier data, estimates and assumptions against each stage.
- Review hotspots: improve detail first where the map indicates the greatest emissions exposure.
Allocation needs particular care when a supplier makes several products. If a factory reports shared energy use, the calculation needs a consistent basis for assigning that activity to each product. Record the allocation approach and apply it consistently across comparable products. Among the scope 3 emissions calculation challenges, inconsistent allocation can make product totals difficult to compare, even when production has not changed.
Transport can span several stages. Distinguish the inbound movement of purchased materials from the distribution of finished goods, and avoid assigning the same journey twice. If route details are unavailable, record the estimate’s boundary and assumptions alongside the activity data.
The practical takeaway is to make the product map traceable before seeking perfect data. It shows which supplier or process could improve the calculation next. To discuss support with complex product calculations, Contact Us.
ContentFactory: ESG Readiness & Materiality Assessments
ContentFactory helps you clarify which ESG issues matter to your organisation and where Scope 3 data needs stronger structure. Turn to an ESG Readiness & Materiality Assessment when category priorities, ownership or reporting gaps are unclear. For calculations spanning suppliers, complex products and estimates, GHG Emissions Calculation and Carbon Accounting can help establish a consistent approach to emissions data and assumptions. Multi-Framework Sustainability Reporting can support the presentation of results across relevant reporting frameworks. These services focus on readiness, calculation and reporting, not audit opinions or assurance.
If you’re ready to set practical priorities for your Scope 3 work, book a 30-minute discovery call with ContentFactory.
Turn your emissions inventory into a working plan
The next step is to decide what your Scope 3 inventory needs to support. A clearer view of emissions can inform which supplier conversations, product reviews and data improvements deserve attention first. Keep that work connected to decisions your organisation can make, rather than treating the calculation as an isolated reporting exercise.
If you need help prioritising work or strengthening your calculation process, ContentFactory offers ESG Readiness & Materiality Assessments, GHG Emissions Calculation and Carbon Accounting, and Multi-Framework Sustainability Reporting. The right starting point depends on whether your immediate gap concerns materiality, emissions data or reporting structure. Addressing that gap gives your team a practical basis for advancing its value-chain work.
The scope 3 emissions calculation challenges you face can become a clearer sequence of decisions, with evidence and ownership behind each one. Contact Us to discuss a suitable next step for your organisation.
Frequently Asked Questions
What are scope 3 emissions?
Scope 3 emissions are indirect greenhouse gas emissions linked to activities across an organisation’s value chain, beyond its direct operations and purchased energy. They can include emissions from purchased components, supplier transport, business travel, and the use or disposal of sold products. For example, a Singapore importer may need to consider emissions associated with products made by overseas suppliers, not only activity at its own premises.
Can you use industry averages for Scope 3?
Yes. The Greenhouse Gas Protocol allows secondary data to estimate emissions from a long tail of suppliers, provided you disclose your approach. Industry averages can support an initial estimate when supplier or activity data is unavailable. Treat them as estimates, not supplier measurements: broad averages may miss differences between products or production methods. Record the factor and assumptions, then improve the data where doing so could materially change your inventory.
How many companies measure Scope 3 accurately?
A survey of nearly 2,000 companies found that 9% reported Scope 1, 2 and 3 emissions comprehensively. That figure measures comprehensive reporting, not the accuracy of each company’s calculations. Accuracy depends on factors such as data coverage, calculation methods and assumptions. A company can report all three scopes while still relying on estimates, so assess the basis and transparency of reported figures rather than treating coverage as proof of precision.
What are the main challenges in measuring Scope 3?
The main measurement difficulties are collecting consistent information across suppliers and partners, matching records to the correct activities, and deciding how to handle gaps. A supplier may report emissions for a whole site while your calculation needs product-level information. Another may provide quantities without explaining the period covered. Keep those differences visible in your records, so estimates are not mistaken for directly measured product data.
What does this look like for a real company?
Hitachi Rail increased Scope 3 accounting coverage from 10-13% of its actual emissions footprint to over 90% by working through its supplier base. The example shows how supplier engagement can expand the portion of a value chain represented in an inventory. For another business, the practical lesson is to map supplier coverage and data gaps, then direct engagement towards the parts of the footprint that remain least visible.
Which calculation method should you use?
Choose a method that fits the activity and the decision you need to make. Spend-based estimates can screen purchases when expenditure records are available. Use activity data when you have quantities, distances or other operational measures. Supplier-specific information can add detail for significant suppliers or products. You can use different approaches across the inventory, provided you record each method and apply it consistently to comparable activities.
Why Is Scope 3 Hard to Measure, and How Can Large Enterprises Overcome It?
Large enterprises often have varied products, suppliers and reporting records across business units. Set shared category definitions and data formats, and assign clear responsibility for each information source. Group similar products for initial analysis, then separate them where material differences emerge. Engage suppliers to improve detail for priority areas, and retain estimates for less material gaps with assumptions documented. This balances consistent corporate reporting with operational realities.
What are the main challenges in calculating Scope 3 emissions?
Calculation becomes difficult when a factor does not match the activity, records use different units, or emissions from a product must be allocated across shared processes. For example, factory energy may support several product lines, requiring a consistent allocation basis. Keep the activity, unit, factor and allocation rationale together. This record helps explain whether a reported change reflects new data, a revised method or changed business activity.

Article by
Mayuresh Godse
Mayuresh Godse is a Singapore Certified Management Consultant and Business Strategist specializing in Sustainability, ESG, AI-driven Digital Transformation, and business growth. Based in Singapore, he writes about Sustainability, Digital Innovation, Business Strategy, and Content Marketing for global audiences.
Disclaimer
This article is provided by ContentFactory for general information only and is not legal, tax, accounting or financial advice. Regulations and government scheme criteria change; grant eligibility and quantum are set by the relevant Singapore agencies and assessed case by case, with no outcome guaranteed. Verify current requirements before acting.